Do you struggle to find good examples of data to help your students learn and practice data analysis skills? The struggle is real! A data analysis lesson can encompass a lot of things, and depending on the data set, can be overwhelming for students. But in the real world, this is an important math skill, as we’re bombarded with information and data all the time. So I hope today’s data analysis worksheet (part of my Math+Technology series) provides an interesting data set and a great opportunity to review important math skills (such as working with percents).
*Please Note: This post contains affiliate links which help support the work of this site. Read our full disclosure policy here.*
Just because students need to know how to analyze and draw conclusions from sets of data, doesn’t mean they need to do every calculation by hand.
Depending on the data, they can use graphing calculators to plot the information on a graph. This allow them to better visualize what’s happening.
Using a calculator can also be helpful in making calculations and comparisons with the data. This shifts the emphasis to what the data says, rather than on the calculations themselves.
It can also be helpful to use a calculator to find measures of center (mean, median and mode) or compare data from one set to another.
This will give students a clearer picture of what the data is telling them, allowing them to form reasonable conclusions. They can then make better decisions based on the data and their conclusions.
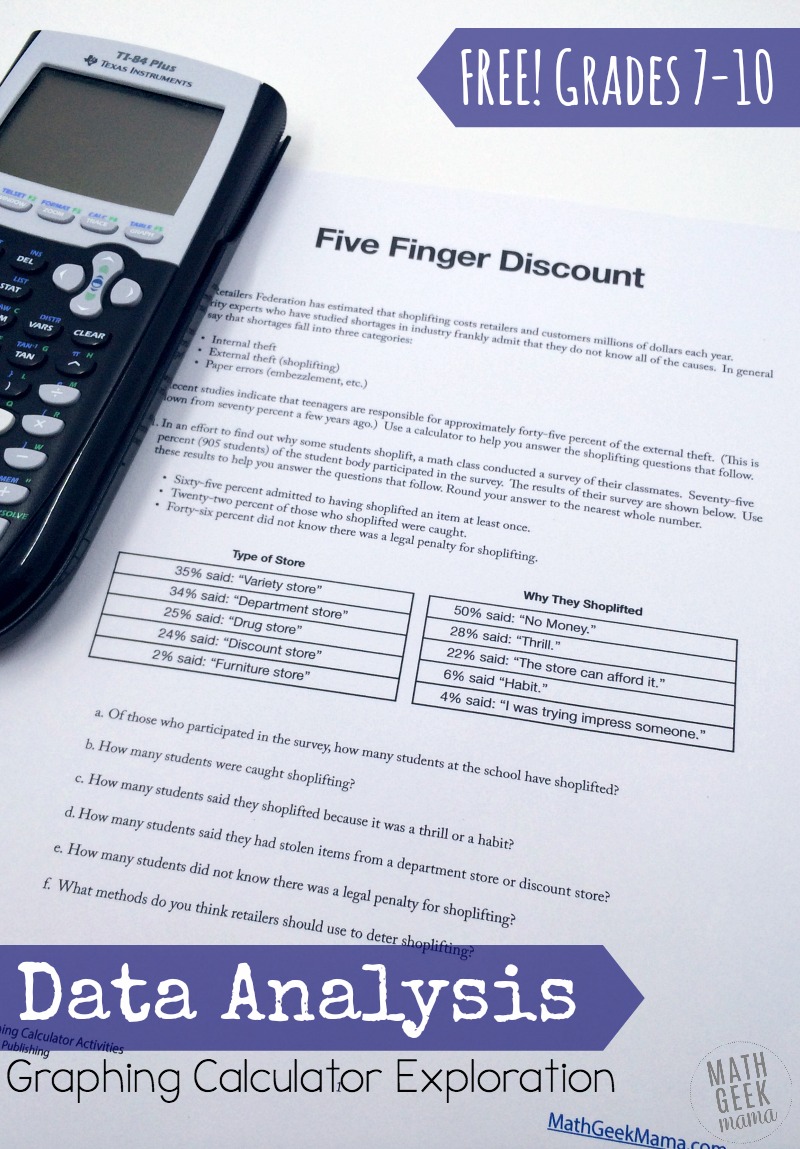
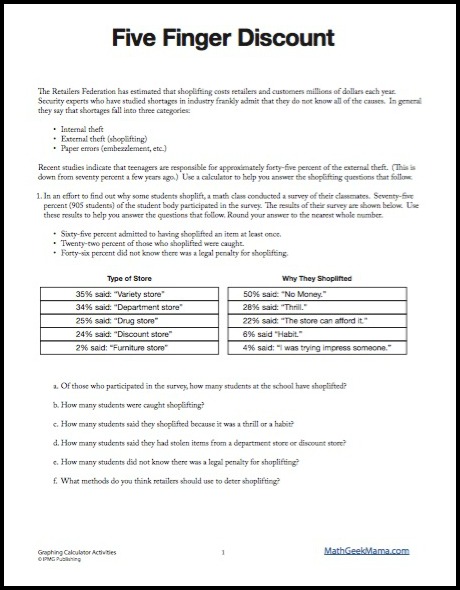
Today’s lesson includes some fascinating data about shoplifting trends and thoughts for kids to consider. They will use the data to answer questions based on the information given.
Students then solve related problems, reviewing skills involving percents and money.
There are a variety of skills necessary to complete this assignment, making it a great opportunity to apply what they know to a real world situation. Plus, they’ll review concepts (especially involving percents) that they may have forgotten.
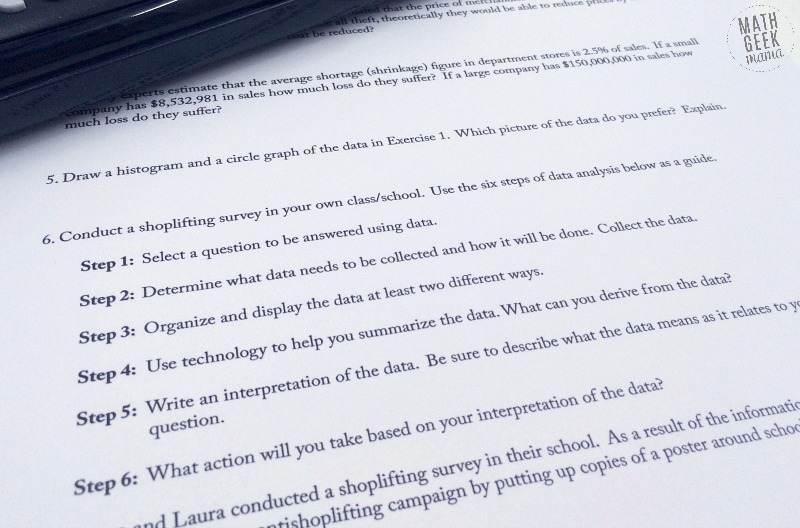
Finally, this data analysis exploration includes a simple data analysis project, which students could complete for homework. In it, they gather their own sample data and compare it to the data they were given.
I hope this provides a fun and interesting data analysis exploration for your students!
**Psst! This lesson is a sample from my ebook, Graphing Calculator Activities: Data Analysis. If you like this lesson, check out the complete resource.
Don’t miss the rest of this Math+Technology Series:
**Want to receive this entire series right in your inbox (including a BONUS lesson)? Sign up right here! It’s free!**

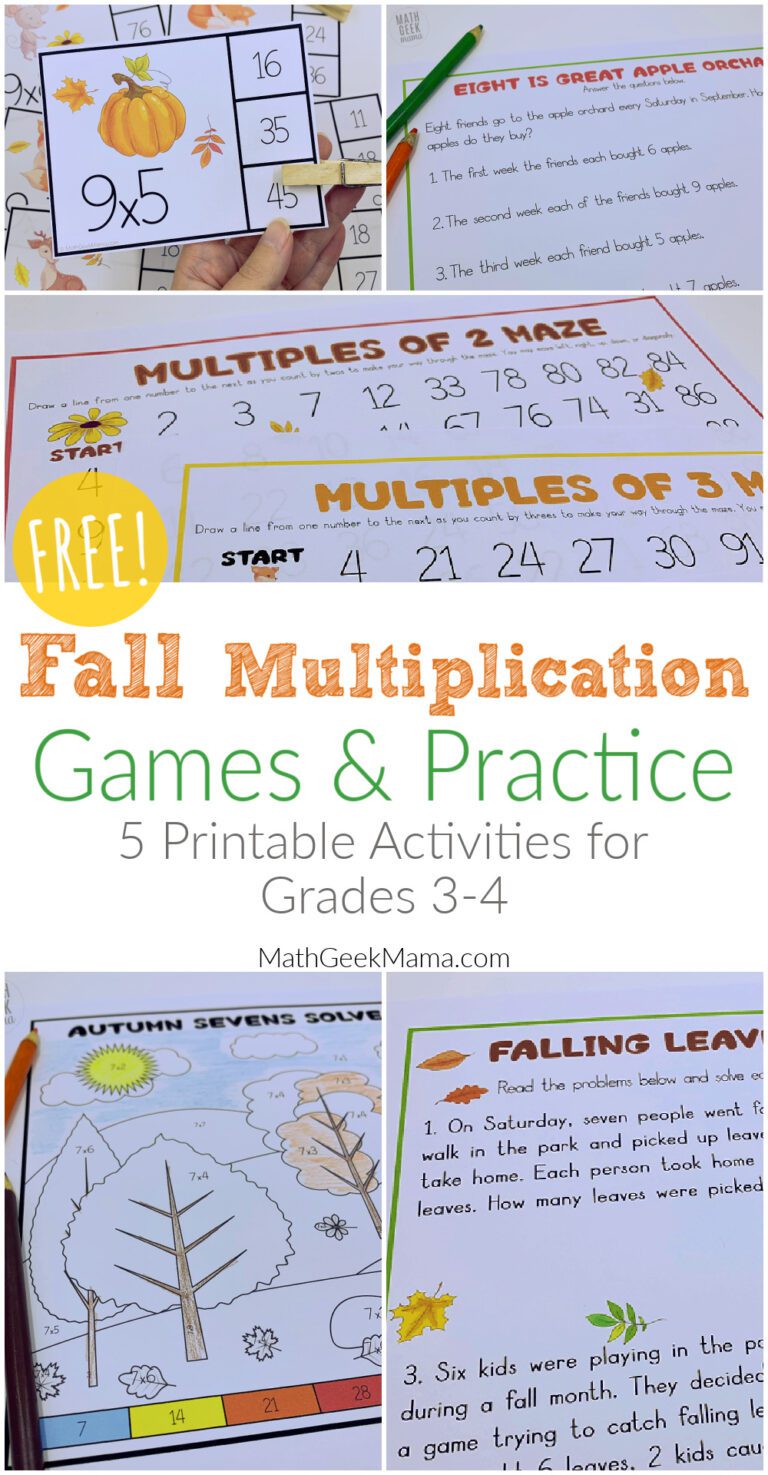 Fall Multiplication Games | Low-prep and FREE" width="768" height="1475" />

I'm Bethany, a.k.a Math Geek Mama. I believe every child can succeed in math with the right help and support. So I'm here to help you provide rich and engaging math lessons without sacrificing your entire weekend. Learn more about the resources I create HERE.
Join 165,000+ parents and teachers who learn new tips and strategies, as well as receive engaging resources to make math fun. Plus, receive my guide, "5 Games You Can Play Today to Make Math Fun," as my free gift to get you started!